Analytics
Real-Time GRC Reporting
Connect your data and access instant, always-updated metrics with real-time GRC reporting, right out of the box. Leverage powerful GRC analytics to monitor governance, risk, compliance and performance as it happens.
How it Works
Pull in data from any source, including Onspring, spreadsheets, .csv files and third-party integrations
Choose how you want to display and visualize your data
Activate real-time views to see live trending and drill into data points for details
Aggregate and arrange report elements onto custom dashboards and shareable reports
Send reports and disclosures as PDF or Word files, or send users directly to interactive dashboards and reports
What to Expect from our GRC Reporting and Analytics
Real-time GRC reporting comes built into Onspring, allowing you to connect your data and instantly measure performance. Use advanced GRC analytics to filter, slice and explore data for more meaningful insights.
One click to clarity
Drill directly into reports to see multiple levels of detail
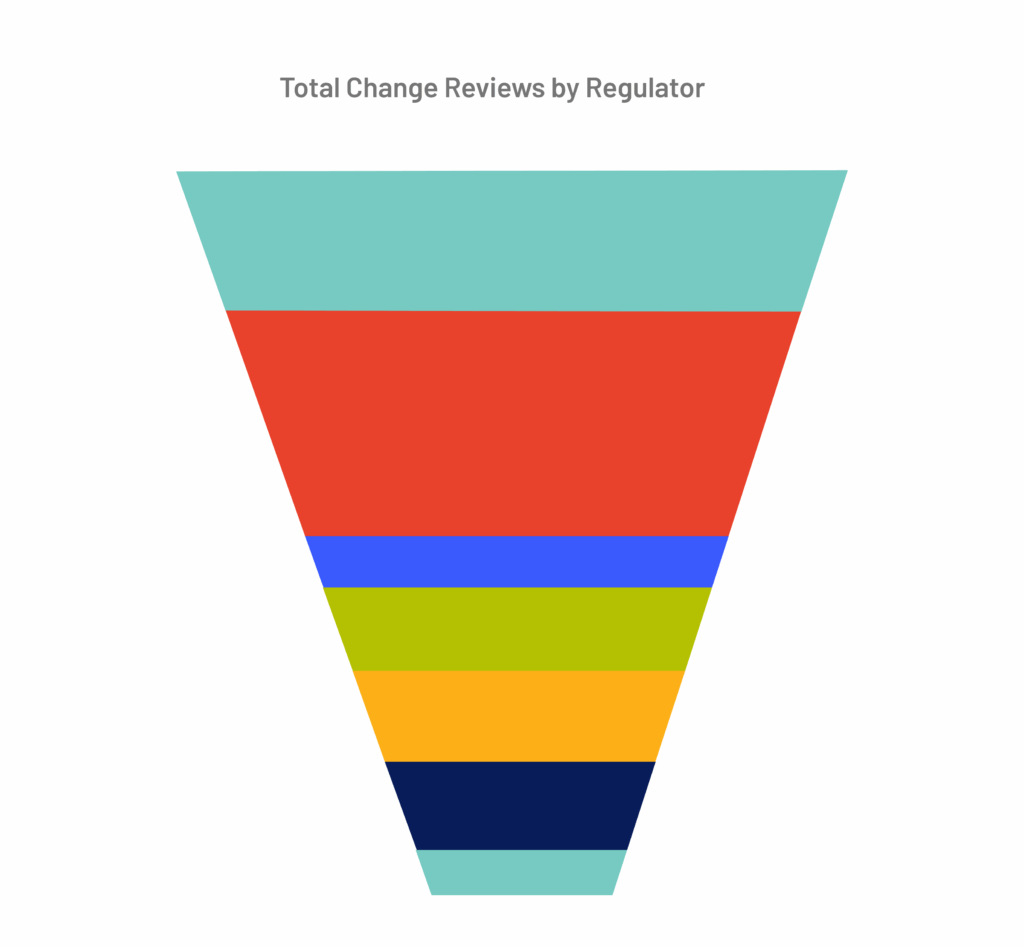
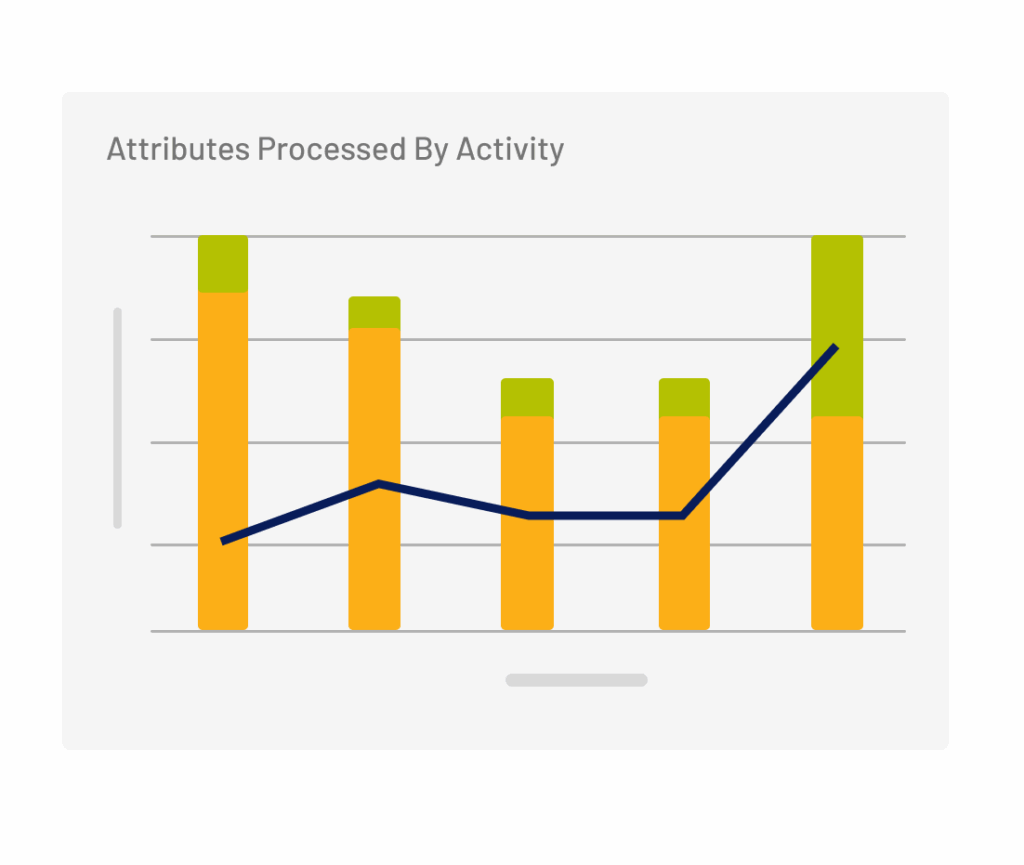
Choose your chart
Drill directly into reports to uncover multiple levels of detail and improve decision-making with GRC analytics.
Know your geos
Enhance GRC analytics by pinpointing data by location to track vendor risk, asset exposure and continuity plans by geography.
Edit live
Update the style or underlying data of your GRC reporting in real time directly from the report.
Filter on the fly
Apply filters to any report, listing or dashboard to refine GRC analytics without interrupting your workflow.
Bulk edit with ease
Make fast updates by applying changes to multiple records directly within your GRC reporting environment.


Success Story

“Custom dashboards remove distractions. You can see exactly what’s assigned at any point in time with visibility into the entire processes.”
Schneider National