Analytics
Real-Time Reporting
Connect your data and see instant, always-updated metrics—right out of the box.
How it Works
Pull in data from any source, including Onspring, spreadsheets, .csv files and third-party integrations
Choose how you want to display and visualize your data
Activate real-time views to see live trending and drill into data points for details
Aggregate and arrange report elements onto custom dashboards and shareable reports
Send reports and disclosures as PDF or Word files, or send users directly to interactive dashboards and reports
What Can You Expect
Real-time reporting comes right out of the box with Onspring. Connect your data and see instant measurement. Then filter and slice your data to curate specific insights.
One click to clarity
Drill directly into reports to see multiple levels of detail
Choose your chart
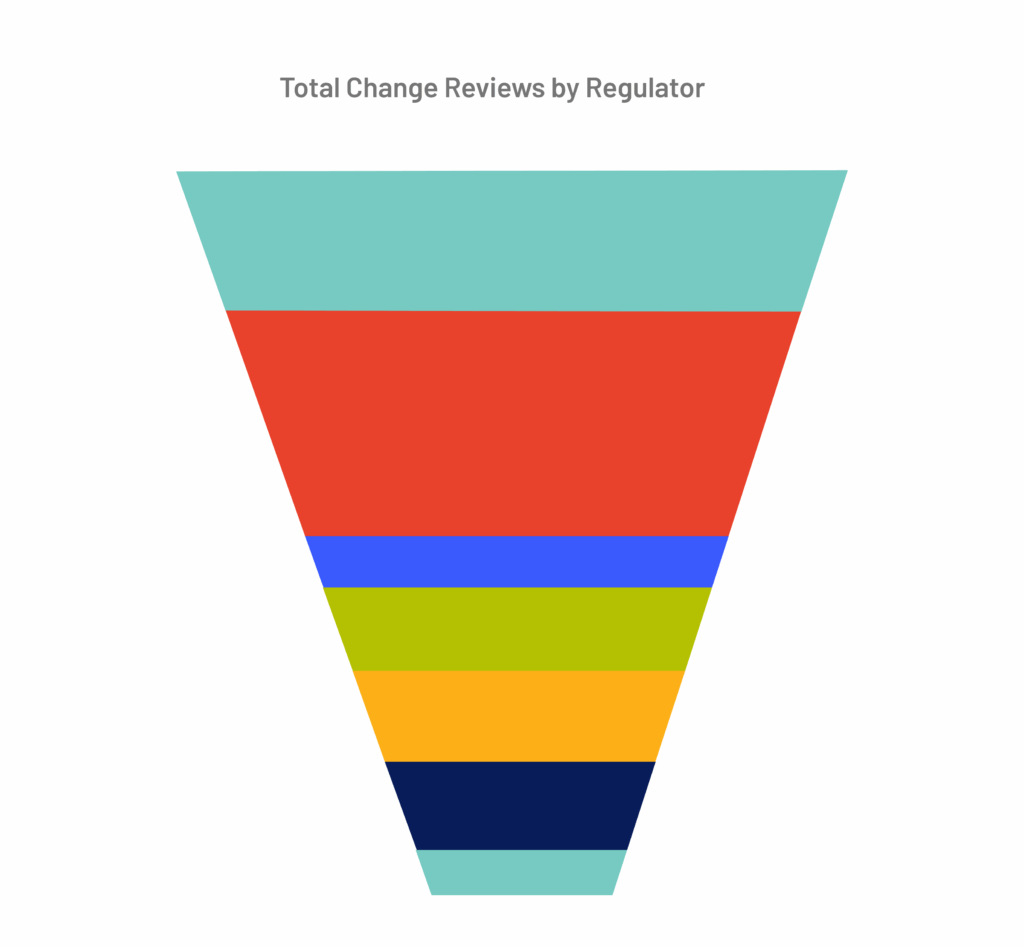
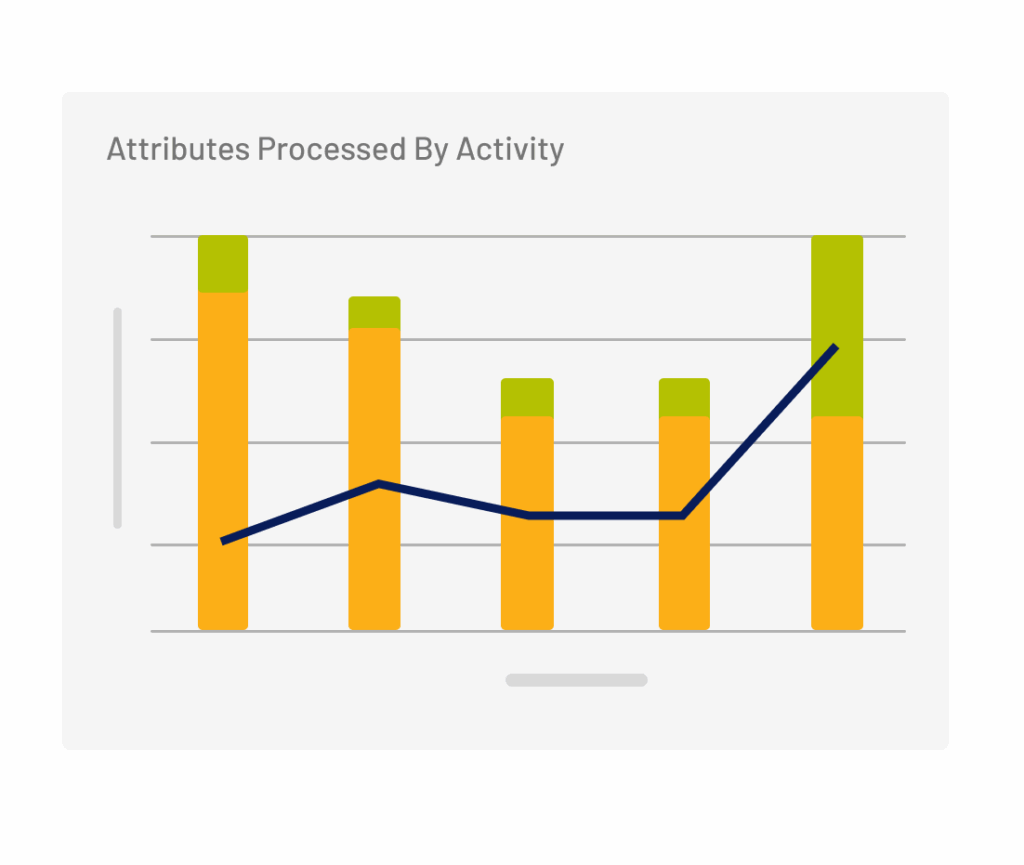
Display bar, column, pie, donut, line, spline, funnel, calendar, Gantt, heat maps and bubble charts
Know your geos
Pinpoint data by location to see vendor venues, asset risks and even continuity plans by geography
Edit live
Change the style or data of your report directly from the report
Filter on the fly
Filter any report, listing or dashboard from where you’re working
Bulk edit with ease
Apply the same change to multiple records directly from a report for fast updates


Success Story

“Custom dashboards remove distractions. You can see exactly what’s assigned at any point in time with visibility into the entire processes.”
Schneider National